Plant Biology Statistical Analytics Pipeline
Statistical Data Science
Overview
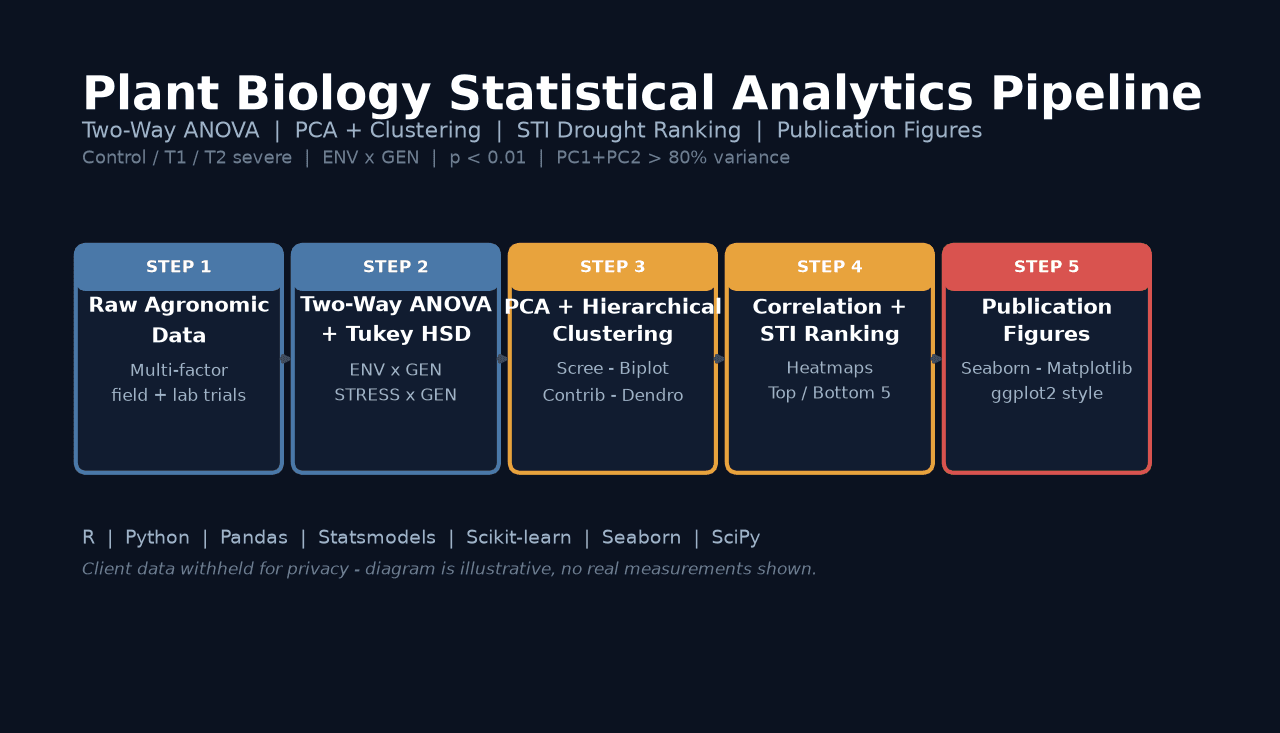
Conducted a full-cycle statistical analysis pipeline for a PhD researcher in plant biology evaluating plant responses to environmental stressors. The pipeline ingests multi-factorial experimental agronomic data, runs data cleaning and normality testing, and conducts Two-Way ANOVA with Tukey HSD post-hoc tests to identify statistically significant genotype-by-environment interactions. Dimensionality reduction via Principal Component Analysis (PCA) and hierarchical clustering revealed underlying phenotypic groupings and isolated key physiological markers for drought tolerance rankings, delivering publication-ready visualizations and statistical tables.
Problem & Solution
Biological research experiments feature complex multivariate interactions across treatments and genotypes, requiring rigorous, reproducible statistical modeling to extract publication-grade insights.
Automated statistical pipeline executing Two-Way ANOVA, Principal Component Analysis (PCA), hierarchical clustering, correlation matrices, and drought tolerance ranking indices.
Architecture & Dataflow
Technical Stack & Implementation
AI / ML & Models
- PCA (Principal Component Analysis)
- Hierarchical Clustering
- Scikit-learn
Backend & APIs
- Python
Frontend & UI
- Seaborn
- Matplotlib
- Publication Figures
Data & Storage
- Two-Way ANOVA
- Tukey HSD Test
- Statsmodels
- SciPy
- Pandas
- NumPy
Technical Challenges & Solutions
Handling non-normal residual distributions and missing experimental values
Disentangling multi-factorial treatment effects across multiple plant cultivars
Generating high-resolution publication-quality plots conforming to journal submission standards
Key Highlights & Results
Identified top drought-resistant genotypes with statistically significant markers (p < 0.01)
Reduced 15+ physiological traits into 2 principal components explaining >80% total variance
Outputs directly integrated into doctoral research manuscript and presentations